Background
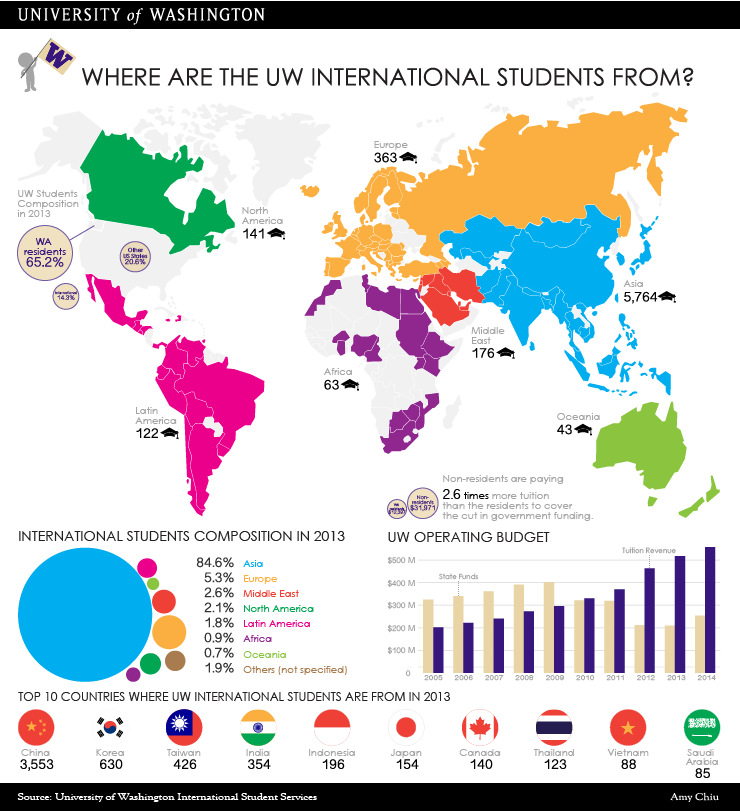
This is a project created for my Information Visualization and Aesthetics course. I were to choose a topic of my own and to create an infographic about this topic. I decided to discuss about the International Student Demography at University of Washington. The information were acquired from university's International Student Services.
Process
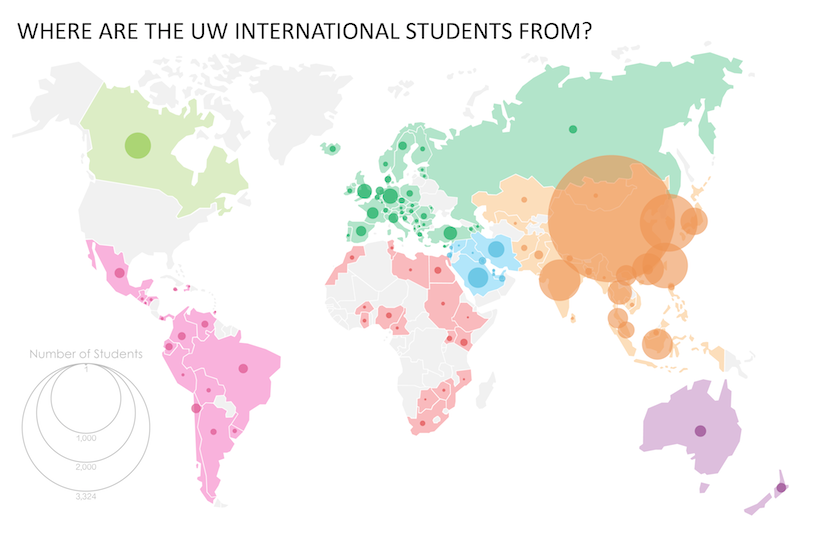
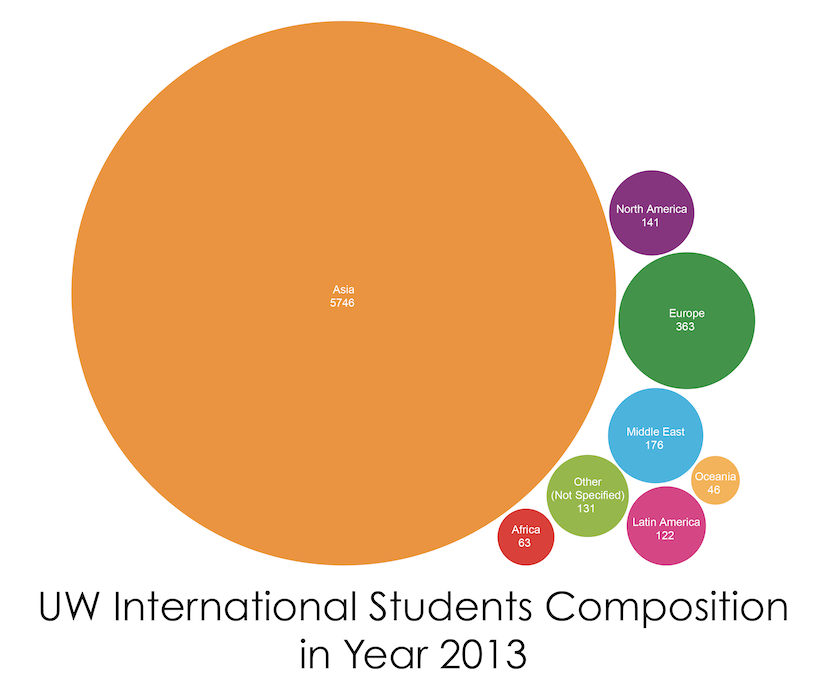
Throughout the course, I examined the visualization of information, considering the effects of human perception, the aesthetics of information design and the mechanics of visual display. Using Illustrator, Excel, and Tableau, I created graphic icons, statistic chart and visualized data display on information regarding UW international students. By the end of the course I created a final infographic that combining parts and pieces of elements that I have created throughout the course.
- Tools: Sketching, Illustrator, Tableau, Excel
- Deliverable: Analysis on other artists' infographics, Graphic design with at least 3 iterations, Final infographic.